Drinking enough water is very important for a healthy lifestyle. Unfortunately, it’s also not that easy for many people in this world of sweet soft drinks and constant distractions—me included.
I had no idea how much or little water I was drinking every day and so I started looking for a way to track just that. There are plenty of apps out there that allow just that, but none of them fit my needs of simplicity and privacy, so I set out to build my own.
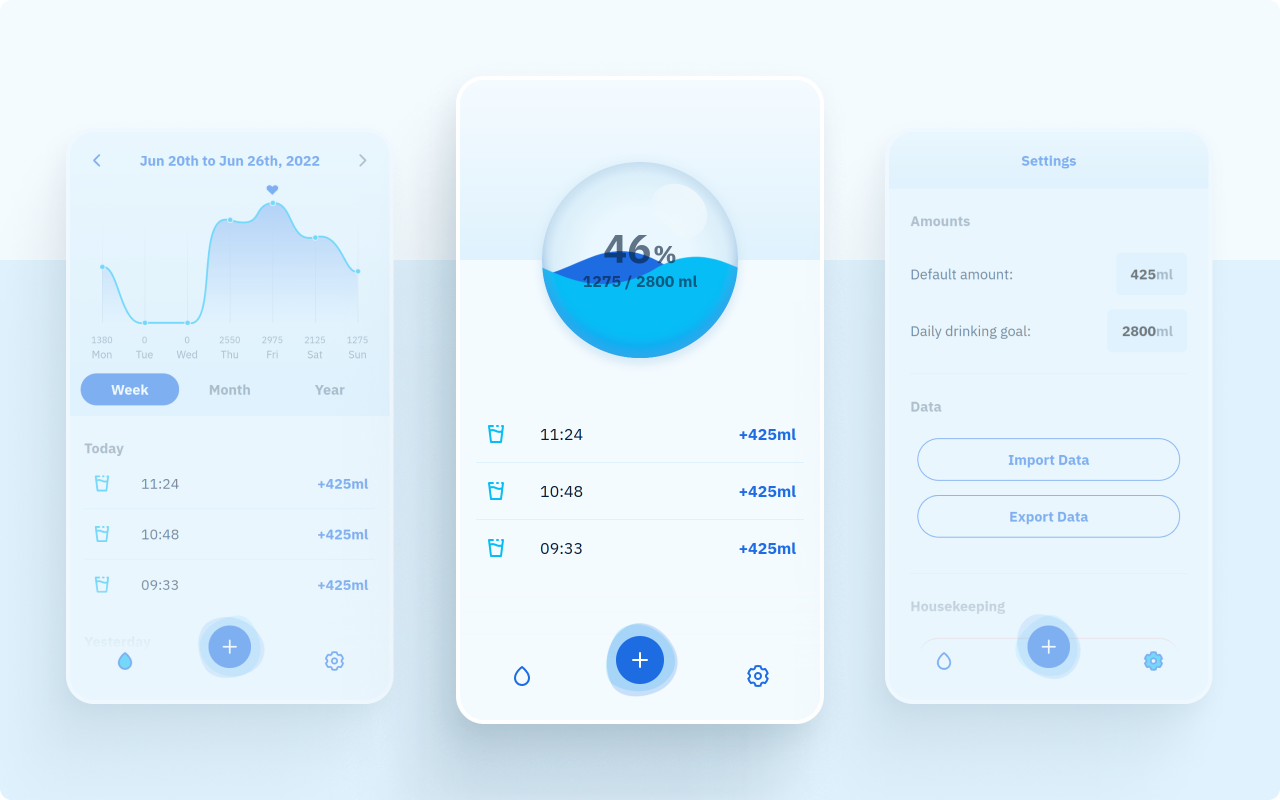
That’s how Hydrt was born. A simple progressive web app with one task: collecting data about how much water the user drinks throughout the day and displaying that in a clear and pleasant way.
While I do have a lot of experience building progressive web apps in Vue by now, I took the opportunity with this one to focus on some key areas:
Learning Vite and the Vue 3 Composition API
Providing a delightful user experience through micro interactions
Upping my motion design game with playful transitions and animations especially during the onboarding of a new user
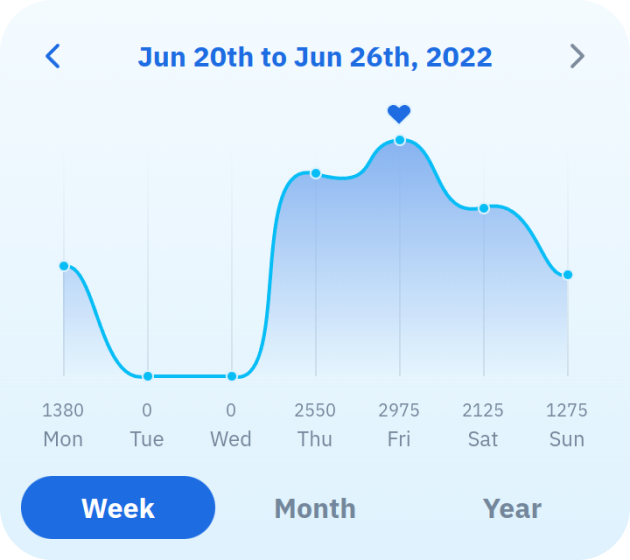
The end result is an app that allow a user to add consumed liquid in just two taps (one to open the app, one to add the liquid) and displays the collected data in a clean and simple, yet informative way that simply flows like water—to quote an early user.